If you’ve got a TelePost LP-100A on the bench, you already know it’s more than a power/SWR meter. It’s a vector watt meter — it measures the actual complex impedance your rig is looking into, not just how much power is bouncing back. The trouble has always been seeing all of that on a modern screen. So I built something to fix that.
LP-100A Monitor is a free, open-source desktop app that reads the LP-100A over its USB serial port and puts the whole picture in front of you — forward power, SWR, reflected power, return loss, dBm, and the load’s R + jX plotted live on a Smith chart. It runs on Windows, Linux, and even a Raspberry Pi.
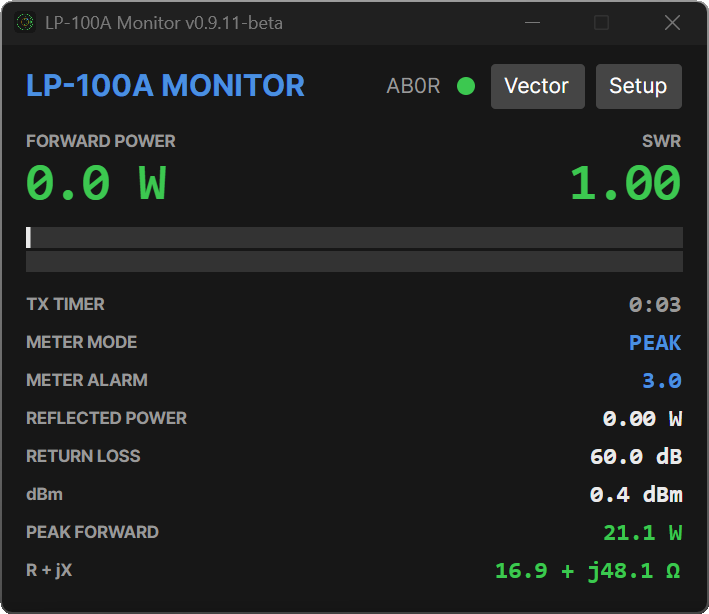
The main window
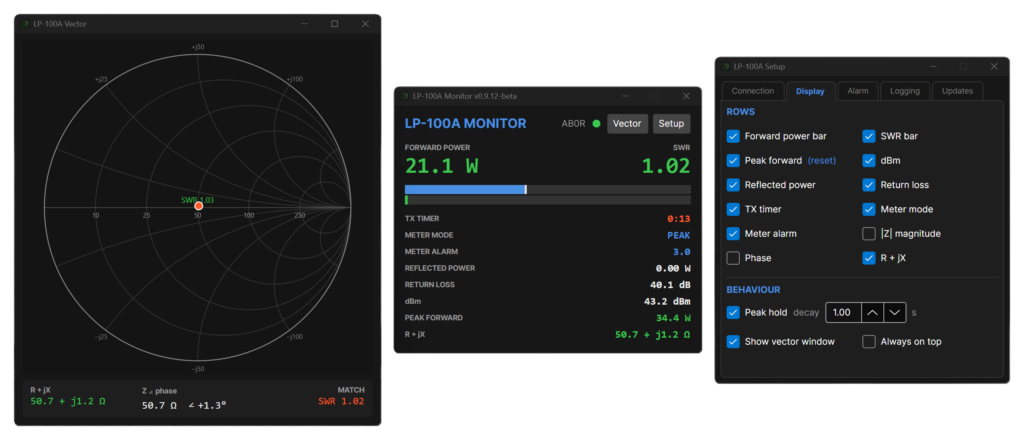
The main window is the everyday view: big power and SWR readouts up top, a forward-power bar with a peak-hold marker so you can catch your PEP, and a color-coded SWR bar underneath. Below that is a stack of readouts you can show or hide to taste — reflected power, return loss, dBm, peak forward, |Z|, phase, and R + jX — plus a TX timer and your callsign.
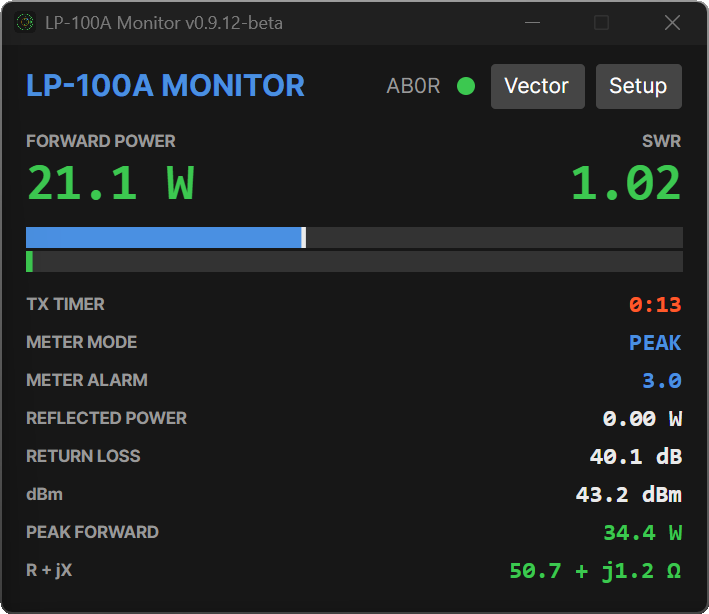
There’s also an optional SWR alarm: set a threshold, and if your SWR climbs past it while you’re transmitting, a red HIGH SWR banner lights up. Cheap insurance for the times you forget to flip antennas.
The Smith chart is the whole point
The reason the LP-100A exists is that it measures impedance, and the reason I wanted a monitor is to watch that impedance move. Pop open the Vector window and you get a proper Smith chart: constant-resistance circles, constant-reactance arcs, ohm labels, a constant-SWR circle, and a marker showing exactly where your load sits — with a short fading trail so you can see it move as you tune.
Adjusting an antenna or a tuner becomes a game of “drive the dot to the center.” Watch the marker walk toward 50 Ω and the reactance drop to zero, and you’re matched — no guessing from a single SWR number about why it’s high or which way to turn the knob. That’s the kind of thing a plain watt meter just can’t show you.
Nuts and bolts
A few things that make it pleasant to live with:
- Cross-platform. It’s built on .NET and Avalonia, so the same app runs on Windows, Linux, and Raspberry Pi (arm64). The downloads are self-contained — no runtime to install, just unzip and run.
- It finds your meter and remembers it. Pick the port once and it auto-connects on every launch. It even pins the USB adapter by its chip serial number, so if Windows renumbers your COM ports, the app still knows which cable is the LP-100A.
- It updates itself. Setup → Updates → Check for updates → Update now, and it downloads the latest build and relaunches. No hunting for zip files.
- Window positions, display choices, and your settings all persist between runs.
Fair warning: it’s beta
This is 0.5.0-beta — real, and in daily use here at AB0R, but not yet beaten on across a lot of stations. One practical note: keep the LP-100A on its Watts screen while monitoring. The serial data reflects whatever display the meter is showing, so if it’s parked on the vector screen, the power numbers won’t come across. (Reverse-engineering that quirk was half the fun of the project.)
A note on how it was built
I wrote this the modern way — pair-programming with Anthropic’s Claude as a coding partner, from reverse-engineering the serial protocol to laying out the Smith chart to cutting the releases. It made a nights-and-weekends project move a lot faster, and I’ll probably write more about that process another time.
Get it
Grab the build for your platform from the releases page:
➡ https://github.com/gsa700/lp100a-monitor/
It’s free and open source (GPLv3). If you run an LP-100A, give it a try and let me know what works and what doesn’t — bug reports and feature ideas are welcome. 73!
— Dave, AB0R